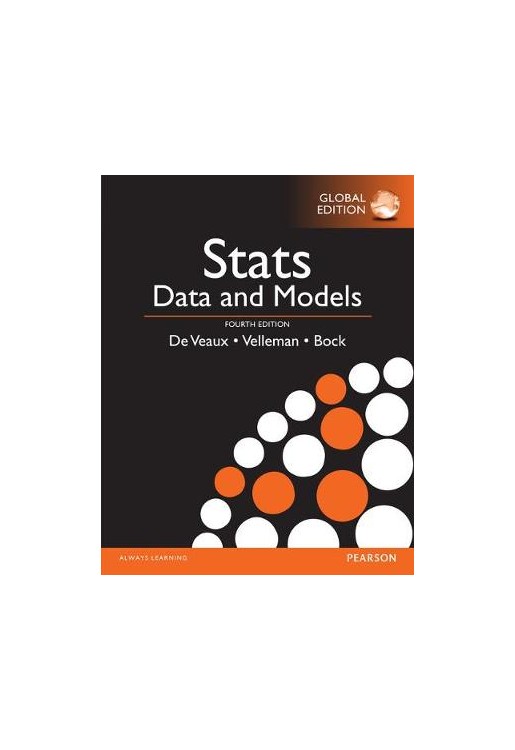


This package includes MyStatLab™.
Richard De Veaux, Paul Velleman, and David Bock wrote Stats: Data and Models with the goal that students and instructors have as much fun reading it as they did writing it. Maintaining a conversational, humorous, and informal writing style, this new edition engages students from the first page. The authors focus on statistical thinking throughout the text and rely on technology for calculations. As a result, students can focus on developing their conceptual understanding. Innovative Think/Show/Tell examples give students a problem-solving framework and, more importantly, a way to think through any statistics problem and present their results. The Fourth Edition is updated with instructor podcasts, video lectures, and new examples to keep material fresh, current, and relevant to today’s students.
This package includes MyStatLab, an online homework, tutorial, and assessment program designed to work with this text to personalize learning and improve results. With a wide range of interactive, engaging, and assignable activities, students are encouraged to actively learn and retain tough course concepts.
MyStatLab should only be purchased when required by an instructor. Please be sure you have the correct ISBN and Course ID. Instructors, contact your Pearson representative for more information.
MyStatLab™ from Pearson is the world’s leading online resource for teaching and learning statistics; integrating interactive homework, assessment, and media in a flexible, easy-to-use format. MyStatLab is a course management system that delivers improving results in helping individual students succeed.
Preface
Part I: Exploring and Understanding Data
1. Stats Starts Here
1.1 What Is Statistics?
1.2 Data
1.3 Variables
2. Displaying and Describing Categorical Data
2.1 Summarizing and Displaying a Single Categorical variable
2.2 Exploring the Relationship Between Two Categorical variables
3. Displaying and Summarizing Quantitative Data
3.1 Displaying quantitative variables
3.2 Shape
3.3 Center
3.4 Spread
3.5 Boxplots and 5-Number Summaries
3.6 The Center of Symmetric Distributions: The Mean
3.7 The Spread of Symmetric Distributions: The Standard Deviation
3.8 Summary—What to Tell About a quantitative variable
4. Understanding and Comparing Distributions
4.1 Comparing Groups with Histograms
4.2 Comparing Groups with Boxplots
4.3 Outliers
4.4 Timeplots: Order, Please!
4.5 Re-Expressing Data: A First Look
5. The Standard Deviation as a Ruler and the Normal Model
5.1 Standardizing with z-Scores
5.2 Shifting and Scaling
5.3 Normal Models
5.4 Finding Normal Percentiles
5.5 Normal Probability Plots
Part II: Exploring Relationships Between Variables
6. Scatterplots, Association, and Correlation
6.1 Scatterplots
6.2 Correlation
6.3 Warning: Correlation ≠Causation
6.4 Straightening Scatterplots
7. Linear Regression
7.1 Least Squares: The Line of “Best Fit”
7.2 The Linear Model
7.3 Finding the Least Squares Line
7.4 Regression to the Mean
7.5 Examining the Residuals
7.6 R2—The variation Accounted For by the Model
7.7 Regression Assumptions and Conditions
8. Regression Wisdom
8.1 Examining Residuals
8.2 Extrapolation: Reaching Beyond the Data
8.3 Outliers, Leverage, and Influence
8.4 Lurking variables and Causation
8.5 Working with Summary values
9. Re-expressing Data: Get It Straight!
9.1 Straightening Scatterplots – The Four Goals
9.2 Finding a Good Re-Expression
Part III: Gathering Data
10. Understanding Randomness
10.1 What Is Randomness?
10.2 Simulating by Hand
11. Sample Surveys
11.1 The Three Big Ideas of Sampling
11.2 Populations and Parameters
11.3 Simple Random Samples
11.4 Other Sampling Designs
11.5 From the Population to the Sample: You Can’t Always Get What You Want
11.6 The valid Survey
11.7 Common Sampling Mistakes, or How to Sample Badly
12. Experiments and Observational Studies
12.1 Observational Studies
12.2 Randomized, Comparative Experiments
12.3 The Four Principles of Experimental Design
12.4 Control Treatments
12.5 Blocking
12.6 Confounding
Part IV: Randomness and Probability
13. From Randomness to Probability
13.1 Random Phenomena
13.2 Modeling Probability
13.3 Formal Probability
14. Probability Rules!
14.1 The General Addition Rule
14.2 Conditional Probability and the General Multiplication Rule
14.3 Independence
14.4 Picturing Probability: Tables, Venn Diagrams, and Trees
14.5 Reversing the Conditioning and Bayes’ Rule
15. Random Variables
15.1 Center: The Expected value
15.2 Spread: The Standard Deviation
15.3 Shifting and Combining Random variables
15.4 Continuous Random variables
16. Probability Models
16.1 Bernoulli Trials
16.2 The Geometric Model
16.3 The Binomial Model
16.4 Approximating the Binomial with a Normal Model
16.5 The Continuity Correction
16.6 The Poisson Model
16.7 Other Continuous Random Variables: The Uniform and the E